Filtering Alternatives#
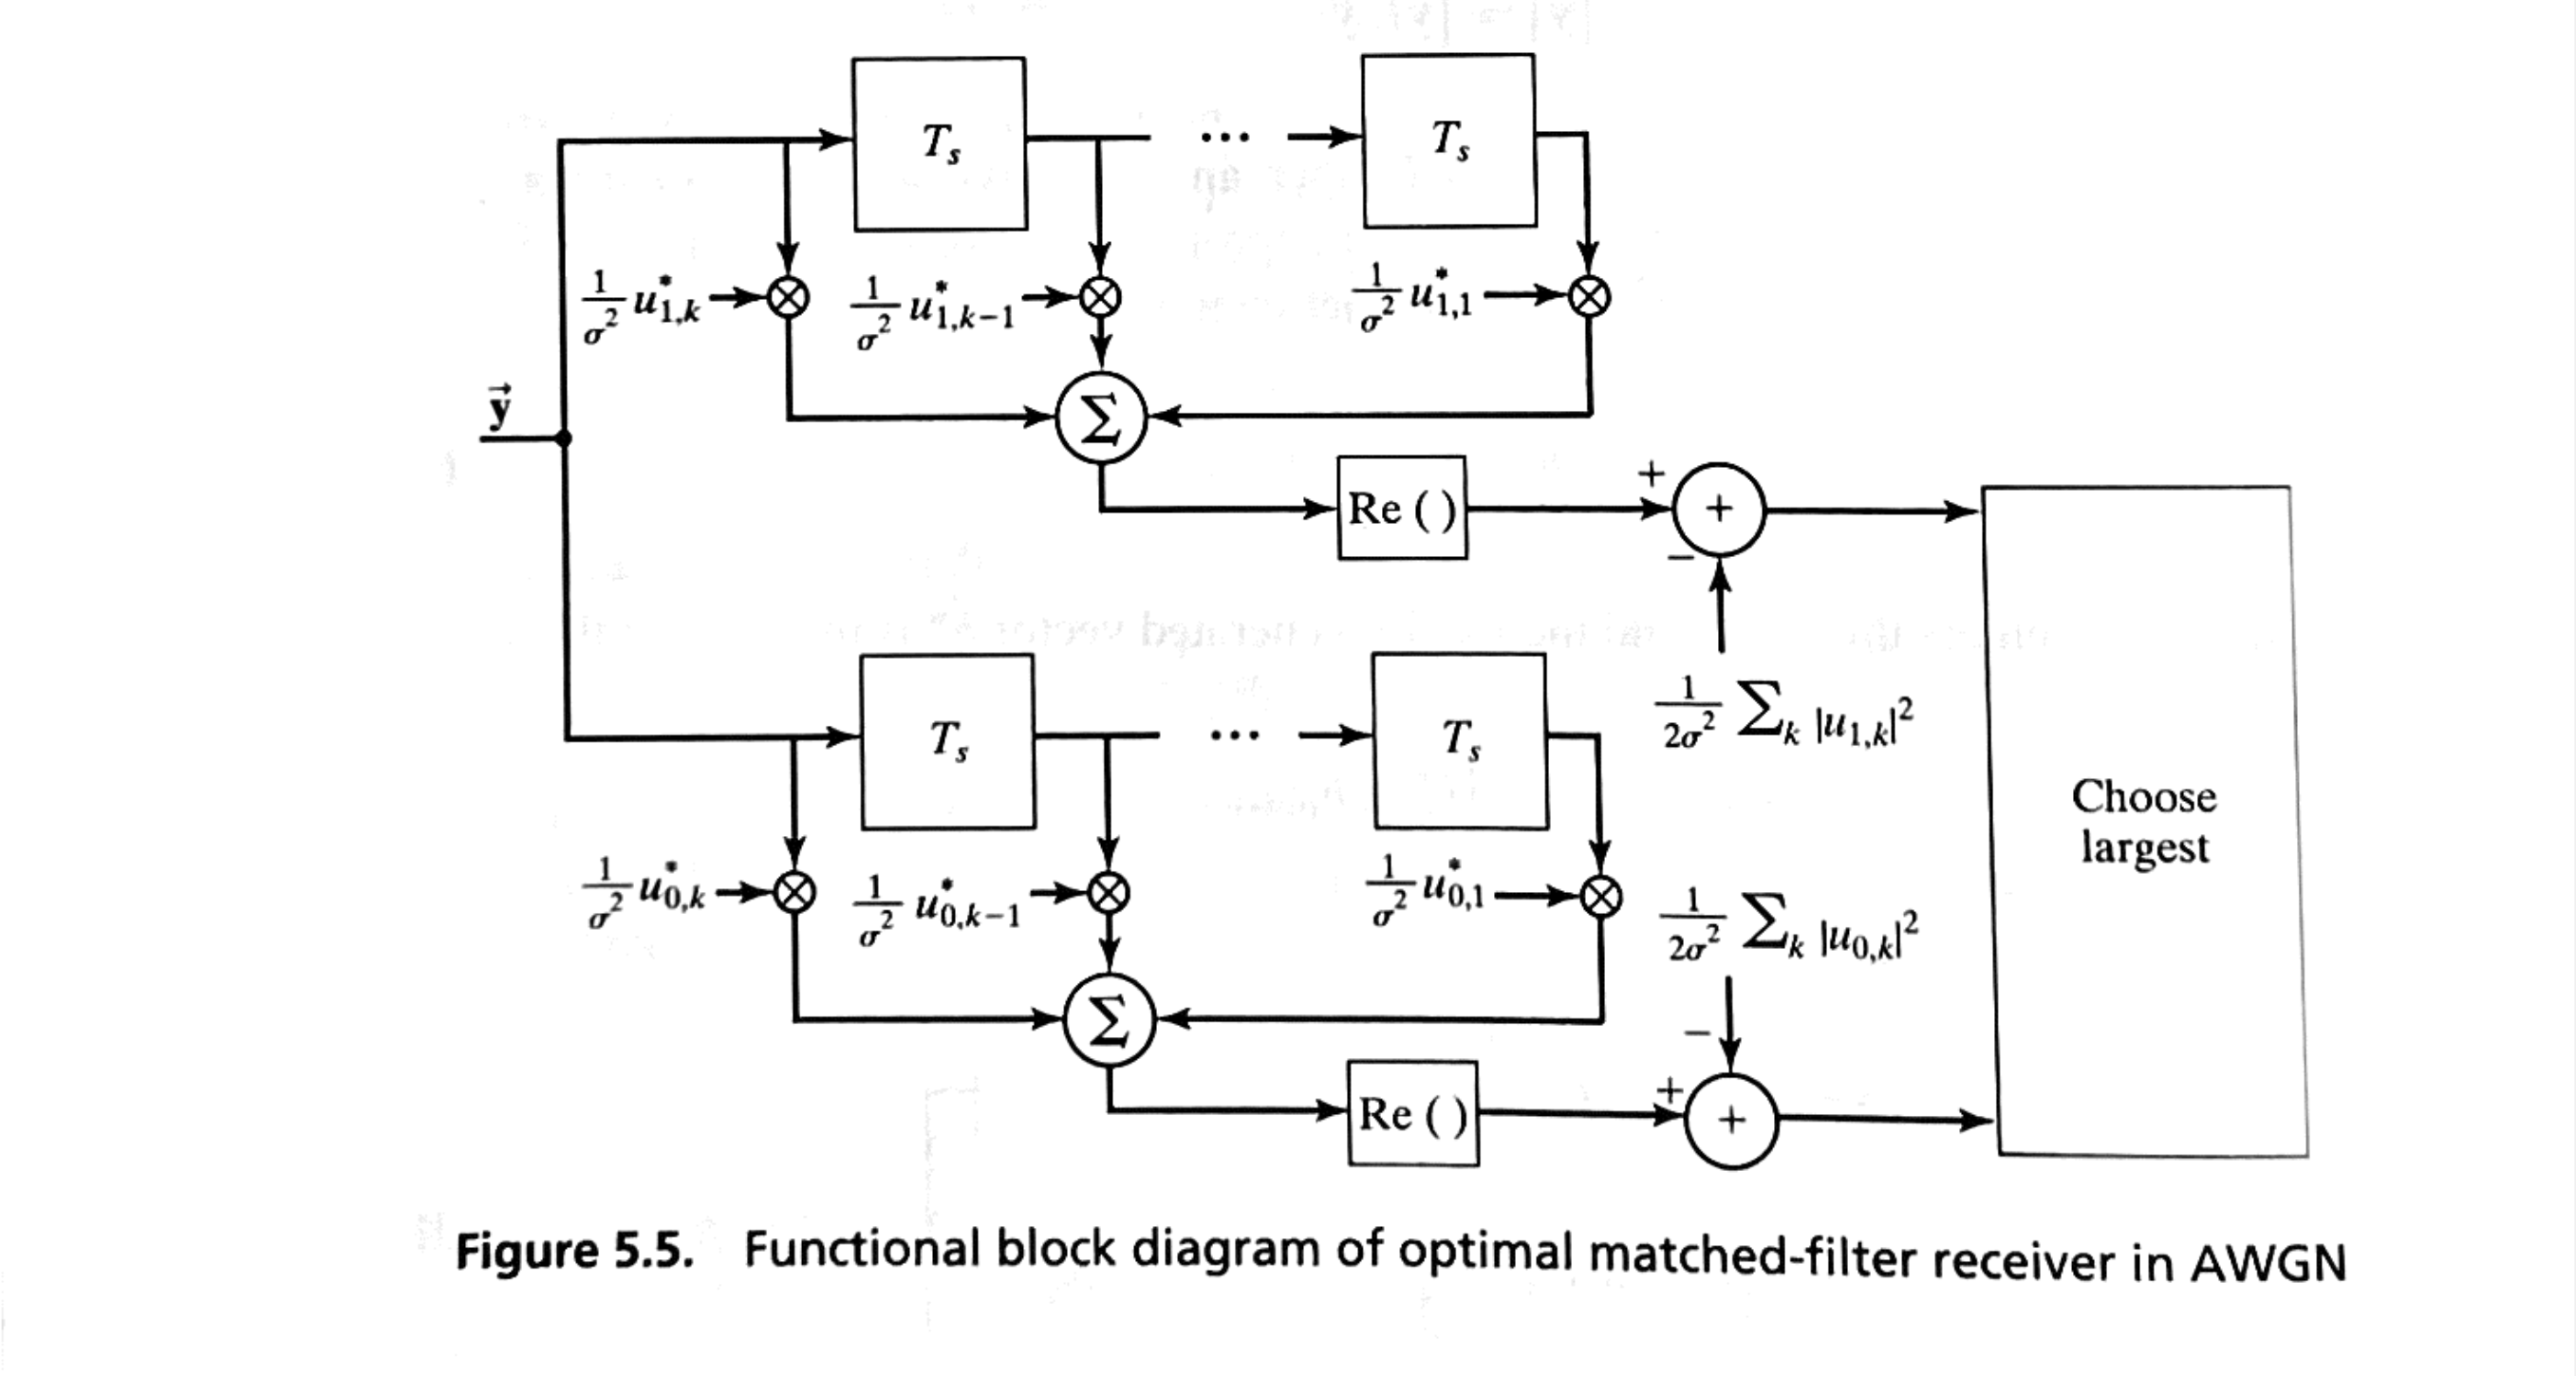
In the previous section, we demonstrated that an optimal detector in the presence of additive Gaussian noise can be constructed by using correlators.
These correlators operate by computing the dot product of the measurement vector, denoted as \( \vec{\mathbf{y}} \), with each of two locally generated vectors, \( \vec{h}_0^* \) and \( \vec{h}_1^* \).
If we consider the measurement vector \( \vec{\mathbf{y}} \) as a sequence of sampled values over time, it can be represented as follows:
where each \( \mathbf{y}_i \) in the sequence is a sample taken at regular intervals, with \( T_s \) denoting the duration between consecutive sampling times.
An alternative to using correlators in this context is to replace them with a digital filter.
This filter would have an impulse response that is designed to achieve a similar effect to the correlator.
In this approach, the digital filter processes the sampled sequence in such a way that it emphasizes or isolates the characteristics of the signal associated with the hypotheses represented by \( \vec{h}_0^* \) and \( \vec{h}_1^* \).
Finite Impulse Response (FIR) Filter#
As an example, consider a finite impulse response (FIR) filter with tap coefficients defined as
These coefficients represent the filter’s weights at each tap, and they are designed to mirror the structure of the locally generated reference vector \( \vec{h}_0^* \).
If the input sequence \( \{y\} \) is processed by this FIR filter, and the reference vector \( \vec{h}_0^* \) is defined as
then it can be shown that the output of the FIR filter at the \( k \)-th sample exactly matches the output of the correlator when performing a dot product. Specifically, at this point, the filter output is given by:
This result confirms that the FIR filter output, when properly configured, replicates the functionality of the correlator by producing an identical result at each sample point.

Matched Filter#
If the noise in the system is white, we observe that the optimal sequence for the \( i \)-th correlator, represented by \( \vec{h}_i^* \), is proportional to the complex conjugate of the noise-free signal associated with that correlator, which we denote as \( \vec{u}_i^* \).
As a result, the matched filter in this scenario has an impulse response defined by:
This impulse response is effectively a scaled version of the sample-reversed, complex-conjugate version of the original noise-free signal.
An important feature of this matched filter is that it maximizes the output signal-to-noise ratio (SNR), outperforming other filter types in this regard.
This characteristic makes the matched filter especially useful in applications where maximizing SNR is critical for accurate signal detection and processing.

[B2, Example 5.4]#
Consider a binary phase-shift keying (PSK) modulation example, where the transmitted bandpass signal during the \( i \)-th signaling period can be modeled as follows:
Here, \( d_i \) is a digital random variable that takes on values of \( \pm 1 \) with equal probability, representing the binary data being transmitted.
For simplicity, we assume that \( f_c \), the carrier frequency, is an integer multiple of \( 1/T \), allowing us to express \( f_c \) as \( f_c = m/T \), where \( m \) is an integer.
This assumption simplifies the transmitted signal model to the form:
This representation makes it possible to view the transmitted signal in terms of a complex exponential form, facilitating analysis in terms of phase.
Consequently, a baseband equivalent of the received signal can be expressed as:
where \( z(t) \) represents a complex-valued white noise process, modeling the noise added during transmission.
From this formulation, we identify the two possible transmitted signals as:
and
Since the signals \( u_1(t) \) and \( u_0(t) \) are constants throughout the bit duration \( T \), this implies that a matched filter designed for operation in white noise will also have constant tap coefficients.

